

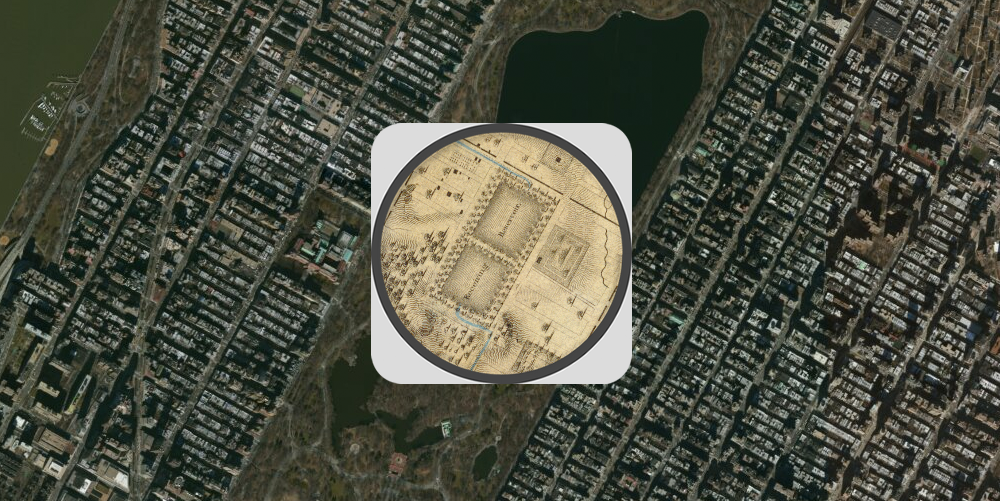
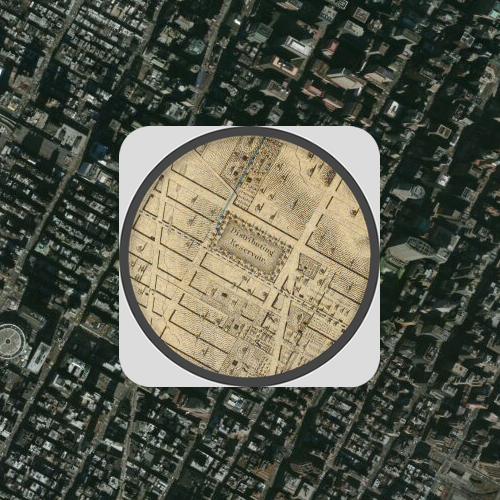
Here’s the perfect follow-up to our recent post on bird’s eye view maps of the Croton Aqueduct—an interactive mashup of an 1836 map of Manhattan, georeferenced with satellite images of the city today.1
Using a “spyglass” map viewer you can switch back and forth between the two maps and explore 177 years of growth and change from the tip of the island to Spuyten Duyvil.
The interactive map is a collaboration between the David Rumsey Map Collection (one of the greatest resources of the internet), ESRI's story maps, and the online Smithsonian Magazine. The three organizations have partnered to create “urban history time viewers showing changes in the growth of six American cities.”
Here’s the link to the New York City map:
of the New York Public Library. Click to enlarge.
Here are links to the other interactive maps:
- What Did Chicago Look Like Before the Great Fire?
- When Real Estate Plotters Planned Out Denver
- Before There Could Be a Los Angeles, There Had to be Water
- When the Lincoln Memorial was Underwater
- What Did San Francisco Look Like in the Mid-1800s?
